Correlation: Is Your Investment Really Diversified?

Table of Contents
Some things go together, like peanut butter and toast, tea and crumpets, soup and breadsticks. That’s fine for the table. However, when it comes to your investment portfolio, a little salt in your coffee can sometimes help you avoid investment trouble.
“Don’t put all your eggs in the same basket,” that’s one of the most common adage every investor has heard. However, diversifying your assets is not as simple as putting your investment in different products.
To safeguard your portfolio from market volatility, you need to understand correlation between your assets.
What is correlation?
Correlation simply describes how two investments move in relation to each other, how tightly they are linked or opposed, meaning when one asset goes up, the other asset moves up, goes down or stays the same. It measures what generally happens to Asset A when Asset B’s price changes. This is measured with a number called the correlation coefficient, which ranges between -1.0 (perfect negative correlation) and +1.0 (perfect positive correlation). Theoretically, a higher correlation means higher risk to the bottom line.
If the markets fall, you don’t want everything in your portfolio to fall at the same time. A better idea is to have some investments that move in opposite directions – or, are “negatively correlated.
What is positive correlation?
The correlation coefficient of +1 is what is known as perfect positive correlation. Two perfectly correlated assets will move in the same direction – when one asset goes up, the other asset goes up.
A simple analogy to describe positive correlation is: The more years of schooling you have, the higher your income will likely be. So, education and income tend to be highly positively correlated.What is negative correlation?
Perfect negative correlation securities will move in opposite directions, and it is measured with the correlation coefficient of -1.0.
A simple example of negative correlation is: The faster you drive the sooner you reach your destination. When the speed of your car increases, the time to your destination moves in the opposite direction – it decreases. So speed and “time to destination” are negatively correlated.
What is no correlation?
A measure of 0.0 means the two assets move independent of one another. For example, there are no links between the price of mushrooms in Moscow, and the price of tea in Sri Lanka, hence, there’s no relationship between the two.
How do market correlations work?
With this in mind you’ll see how market correlations work in interesting ways. For example, in August and September, the Chinese stock market fell 27%. During the same period the Hong Kong stock market declined 15%. You can see the relationship between the two over the past seven months in the chart below.

During this time, these two indices had a correlation coefficient of +0.93, which means they’re positively correlated. The two markets generally move in the same direction at the same time. This makes a lot of sense, as China’s and Hong Kong’s economies and companies and politics are closely linked. This high level of correlation is an important thing to know if you’re invested in both – if one falls, the other one probably will too.
One way to protect your portfolio from market drops is to have holdings that have a low, or negative, correlation assets that don’t move together. So when one asset falls, the other asset moves in the opposite direction, or, at least falls less.
Now, let’s have a look of how negative correlation looks like in the market. The chart below compares the Hang Seng Index to gold prices since 2011.

Notice how the Hang Seng Index and gold prices mostly move in opposite directions. The correlation between the two has been -0.6 since 2011 – they’re negatively correlated. This means gold can insulate you against a fall in the Hang Seng Index. On the other hand, the Hang Seng Index will offer some protection when the price of gold falls. Having both in your portfolio would have helped diversify it.
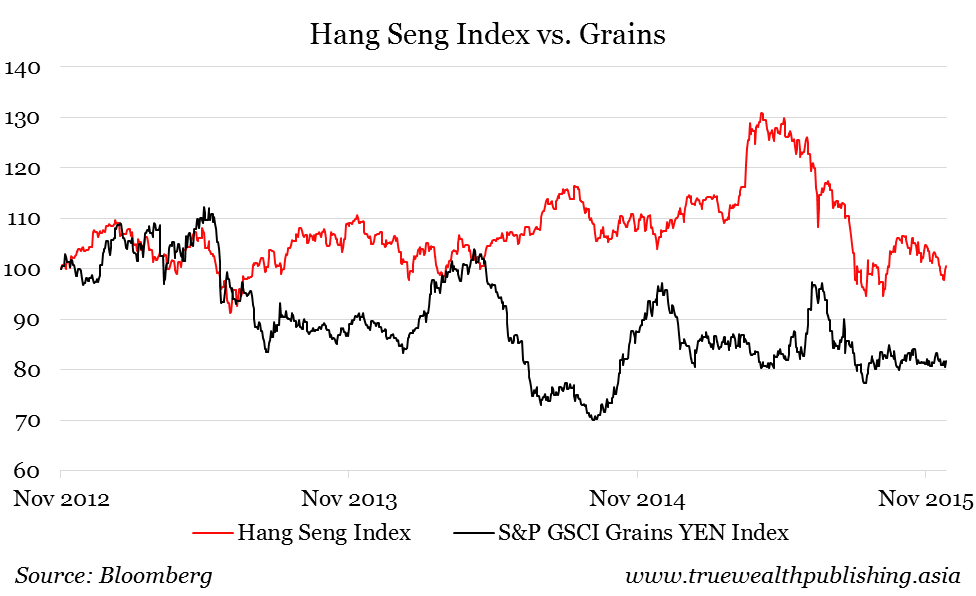
Another example of negative correlation is the Hang Seng Index and the S&P Grains Index (which tracks grain prices) over the past three years. The correlation between the two is -0.4, so when one moves up, the other one (generally) does the opposite.
Sometimes, the price of almost every asset falls, such as during times of extreme distress like the global economic crisis of 2008. But most of the time, investing in different asset classes that have a low, or negative correlation, helps to reduce the overall risk of your portfolio.
What can you do?
Now that you know how correlation works, here’s how you can apply it to your portfolio.
Calculating the correlation of the stocks and funds you own is one way and that requires some historical price data, and a few simple tricks on Excel. A different way to ensure that you have at least part of your portfolio that’s not correlated with anything else is simply – own some gold.
The precious metal has proven over time that it doesn’t dance to the same beat as stock markets. For example the correlation between gold and the S&P 500 is just -0.07 over the past 30 years, while the correlation between gold and the Malaysian stock exchange (KLCI) over the same period is 0.05.
That doesn’t mean that gold won’t fall if everything else falls, or that it will rise if everything else falls. A correlation that’s very low, or close to zero, means that gold’s price has no relationship to stock markets. That’s a good thing to have to balance your portfolio.
How does your investment portfolio fare? It’s never too late to go back to basics and ensure your portfolio is properly diversified by adding some salt in your coffee.