iMoney Monthly Budget Survey Results

Table of Contents
When the Employees Provident Fund released the Belanjawanku reference budget in early March 2019, there was a lot of backlash and criticism from Malaysians. Some of the feedback was the findings were unrealistic and out-of-touch. This inspired us to run a survey on the subject.

In our own iMoney Monthly Budget Survey, we asked residents of the Klang Valley to share their spending habits.
Admittedly, our research was not as extensive as the year-long study conducted by University Malaya’s Social Wellbeing Research Centre. After all, our own poll only ran for 10 days and it was completely online.
However, the 1,000 respondents that took part in the survey, shared very useful information that we can use as an indicator on how “realistic” the figures in the Belanjawanku guideline are.

Married couples are careful with money
Our budget results were based on the median value as provided by our survey respondents. This gave us the closest amount to how much the majority of Klang Valley dwellers are spending every month. It also helped eliminate the impact of statistical outliers.
Married respondents showed similar monthly budgets as those recommended by the EPF – after adjusting for the different categories. The exact breakdown differs, particularly when comparing spending on food, transportation, and accommodation.


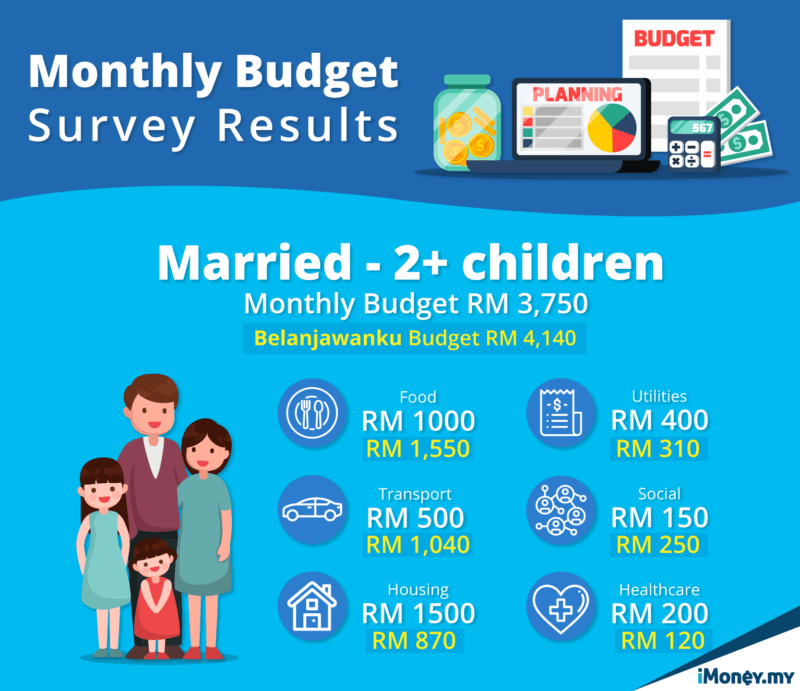
Overall, it shows that the reference budget makes sense as far as couples go. The results also indicate that people become more careful with their money as they get older.
Single spending
However, we found that our numbers diverged when it came to single individuals. Single respondents from our survey spent RM2,695 each month if they owned a car; far more than the RM2,490 recommended by the Belanjawanku.

This difference becomes even more significant if the EPF’s budget is adjusted to only take into account the categories in our survey. The difference then becomes RM2,695 against the EPF’s RM1,900.
The most noticeable differences are in housing, healthcare, and utilities.
The median amount spent on housing was RM1,100, with barely any difference between those renting a house and those who are servicing a home loan.
However, we should point out that our values are already adjusted lower as some home owning respondents are not paying anything for their homes. Possibly indicating that some have already paid off their loans or obtained the property through other means.
The median amount being paid for renting a room in the Klang Valley was RM680. This data was processed separately from the home-owners and renters to obtain a clearer picture of housing costs. Yet, the amount is still more than double the RM300 housing budget the Belanjawanku recommends.
Single respondents on the whole also spent as much as married couples with no children. Both categories had a median spending amount of RM600 each month for food. What is interesting is that this is below the Belanjawanku’s amount for married couples, but above the amount for single people.
The statistic can be explained by the frequency at which single people eat out. Some 49% of single respondents reported eating out every day, while 39% said they eat out a few times a week.
In comparison, only 33% of married (with no children) respondents ate out every day.
Health concerns
The biggest disparity between Belanjawanku and our survey was in healthcare expenditure. The EPF’s reference amount of RM30 is far below the RM145 median spend we saw in our survey.
Both reports assume that the respondents are fully healthy individuals and are not on any special medication.
Both these assumptions bring us to different conclusions about the individuals’ spending habits. In the Belanjawanku’s case, it is likely spreading an annual cost across 12 months. Much like it does for the annual and discretionary expenses categories.
In the case of the iMoney Monthly Budget survey, the number is representative of how much is being spent each month. However, it should be noted that the actual individual amount varies. For instance, 22% of respondents claim to not spend any amount on healthcare at all.
Personal refinancing
Our own statistics have shown a sharp rise in applications for personal loans between 2016 and 2018. This was highlighted by 370% spike by the end of 2018.
Internal customer surveys have shown that a majority of applications are made with the intention of personal refinancing and debt consolidation, indicating that there is a substantial number of Malaysians still struggling with debt.
This data corresponds with the Credit Counseling and Management Agency’s (AKPK) Financial Well-Being Survey 2018; which showed that 28% Malaysians have had to borrow money in order to buy essential goods.
Almost half (44%) of these vulnerable people belong to those in the army, police, enforcement, agriculture, and commodity sectors.
Furthermore, it also showed that half of its respondents only have enough money to cover essential needs, unable to spend on things they want instead of solely on things that they need.
It becomes even more important for Malaysians to understand their financial standing so they can take up a credit product, if they need to, in times of need.
The first step is to really take a long, hard look at their monthly budget, and see how it can be trimmed. It’s definitely a warning sign if their expenditure is higher than their wage.
As a last resort, if a credit facility like a personal loan is required, they should first check on their credit score. This will give them a better understanding their credit health and debt-service ratio as well as the best products available for their needs and eligibility.
Having a full picture of your financial health will also help you be more responsible in your borrowing.
Check your credit score for free with iMoney CreditScore.
What does this mean?
The original goal of the Belanjawanku was to provide a reference budget for Malaysians, while also highlighting the need for a higher minimum wage.
iMoney’s goal was to compare the EPF’s numbers against the reality faced by our readers.
We note that the reported median wage in Selangor is RM2,580, while Kuala Lumpur has a median wage of RM2,650. Both of which are almost exactly the amounts being spent by our readers without having the opportunity to save.
The EPF’s data that shows 9 out of 10 Malaysians had no savings back in 2016 made so much sense.
To conclude, we are thankful for the EPF and UM’s efforts in conducting their study. It’s important to have empirical data about the state of income in Malaysia; because while we’re all aware that it’s a problem, it is nice to have some facts to present to support the reality that we are all facing daily.